Usage Analytics & Reporting
Kilo for Teams provides detailed usage analytics to help you monitor and understand your team's AI usage patterns, costs, and activity through the Kilo Code API provider.
Analytics Dashboard Overview
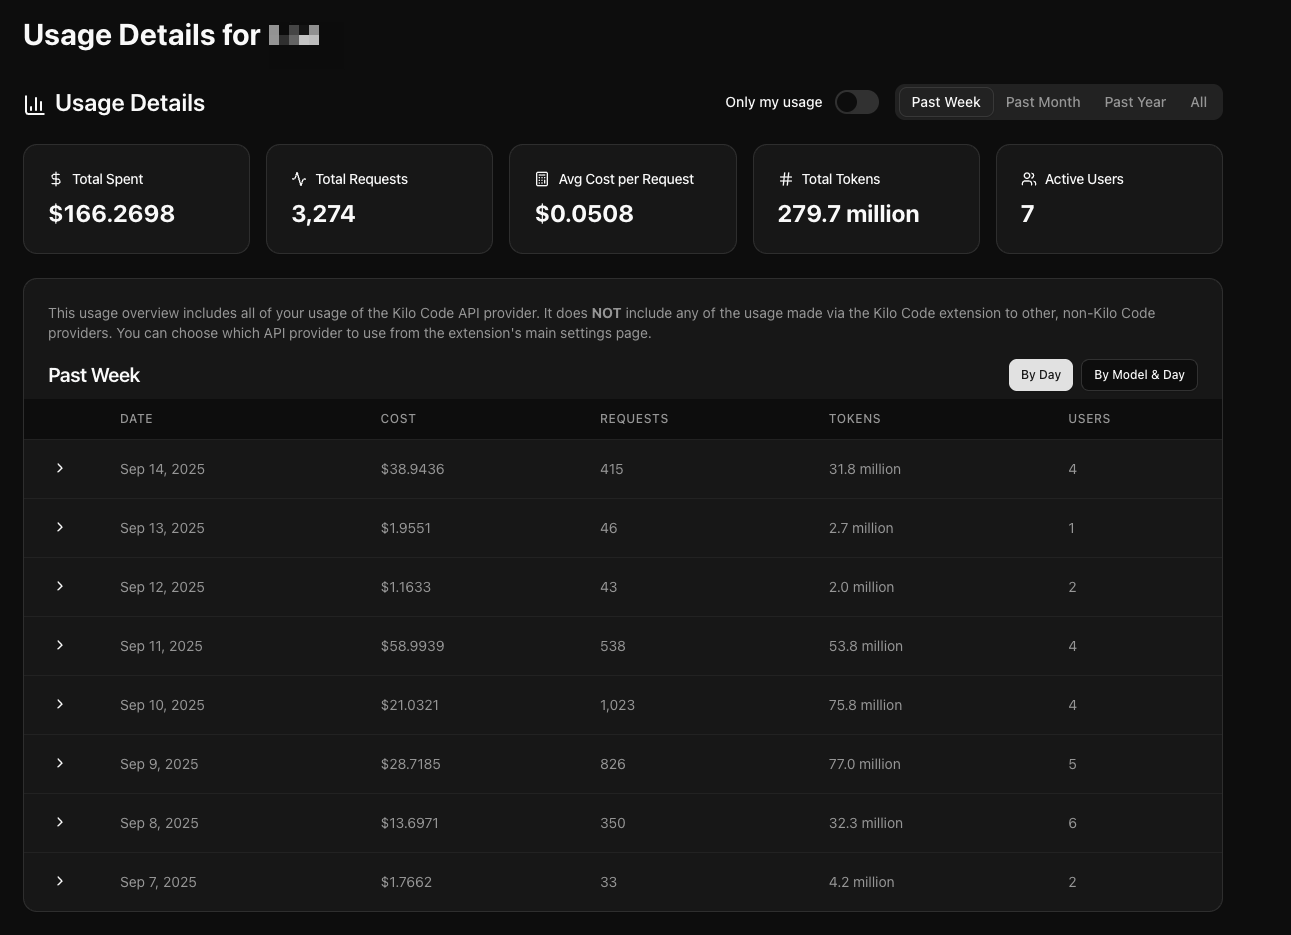
Access your team's usage analytics through the Usage Details section in your dashboard. The analytics show comprehensive data about your team's usage of the Kilo Code API provider.
This usage overview includes all of your usage of the Kilo Code API provider. It does NOT include any usage made via the Kilo Code extension to other, non-Kilo Code providers. You can choose which API provider to use from the extension's main settings page.
Summary Metrics
The dashboard displays five key metrics at the top:
- Total Spent - Total cost for the selected time period
- Total Requests - Number of API requests made
- Avg Cost per Request - Average cost per individual request
- Total Tokens - Total tokens processed (input + output)
- Active Users - Number of team members who made requests
Time Period Filters
Select from four time period options to view usage data:
- Past Week - Last 7 days of usage
- Past Month - Last 30 days of usage
- Past Year - Last 365 days of usage
- All - Complete usage history
Usage View Options
Only My Usage Toggle
Use the "Only my usage" toggle to filter the data:
- Enabled - Shows only your personal usage data
- Disabled - Shows team-wide usage data for all members
Data Breakdown Views
Choose between two data presentation formats:
By Day View
Shows usage aggregated by date with columns:
- DATE - The specific date
- COST - Total spending for that date
- REQUESTS - Number of API requests made
- TOKENS - Total tokens processed (hover to show input vs. output tokens)
- USERS - Number of active users that date
When viewing team data, you can click on any date row to expand and see individual user breakdowns for that day, showing each team member's usage, cost, requests, and tokens.
By Model & Day View
Shows detailed usage broken down by AI model and date with columns:
- DATE - The specific date
- MODEL - The AI model used (e.g., anthropic/claude-sonnet-4, openai/gpt-4)
- COST - Cost for that model on that date
- REQUESTS - Number of requests to that model
- TOKENS - Tokens processed by that model (hover to show input vs. output tokens)
- USERS - Number of users who used that model
Click on any row to expand and see which specific team members used that model on that date, along with their individual usage statistics.
Understanding the Data
Model Information
The analytics track usage across different AI models, showing the specific model identifiers such as:
anthropic/claude-sonnet-4openai/gpt-5x-ai/grok-code-fast-1mistralai/codestral-2508
User Attribution
When viewing team data, you can see:
- Individual team member usage within expanded rows
- Email addresses for user identification
- Per-user cost, request, and token breakdowns
Cost Tracking
All costs are displayed in USD with detailed precision, helping you:
- Monitor spending patterns over time
- Identify high-usage periods or models
- Track individual team member contributions to costs
Next Steps
- Manage team billing settings
- Configure team roles and permissions
- Learn about team roles and permissions
The usage analytics provide the insights needed to optimize your team's AI usage while maintaining visibility into costs and activity patterns.